-Knowledge Base-
Characterization of Odor & Taste Components
Characterization of Odor & Taste Components Using Olfactory Detection and SPME GC-MS
Amy Porter, Senior Analytical Leader
Karen Griffin, Senior Analytical Chemist
Introduction
Consumer products are often stored in large warehouses and transported in trucks with a variety of other products. As the temperature of these facilities rise, the compatibility of the products can become an issue. If a highly odorous product is stored too closely to, or shipped with, an odor absorbent product, odor and taste issues can result. In this work, solid phase microextraction (SPME) was used to sample the air around odorous consumer products. The samples were analyzed via gas chromatography (GC) coupled to mass spectrometry (MS) and olfactory detection, run in parallel. This allowed for odors to be recorded when the concentration was too low for MS detection, but still significantly high enough for human detection.
When a component is detected by both the mass spectrometer and the ODP, the mass spectral data can be used to aid in identification of the odorous compound. The method used in this work can be used to establish appropriate storage distances in warehouses and the compatibility of products that may be shipped together.
Experimental
Data was collected using an Agilent 7890 GC with a 5975 mass selective detector (MSD) and a GERSTEL Olfactory Detector Port ODP3, in series. In this configuration, a tee is placed at the end of the analytical column and the effluent is split between the MSD and the ODP detectors. The MSD collects data as normal while a trained analyst is positioned at the end of the ODP detector to monitor for odors.
When the analyst detects an odor, a button is pushed on the keypad and a description of the scent is verbalized by the analyst, into a microphone. The description of the scent is recorded by the software and, when desired, appears on the olfactogram. Olfactograms are generated from the data input into the keypad. Each time a button is pushed on the keypad, a peak is generated for the olfactogram indicating that an odor was detected by the analyst at that retention time. Relative intensity of the odor can be recorded by the use of the four buttons available on the keypad which represent low to high intensity.
A non-odorous consumer product (sandwich bag or plastic food container) was stored for four hours, at room temperature, in the immediate proximity of, an odorous consumer product (air freshener, carpet cleaner, dryer sheets). The non-odorous product was then placed in a jar and a Supelco Field Portable SPME fiber exposed for 2 hours. A baseline sample was collected for each of the odorous and nonodorous consumer products for comparison.
Results and Discussion
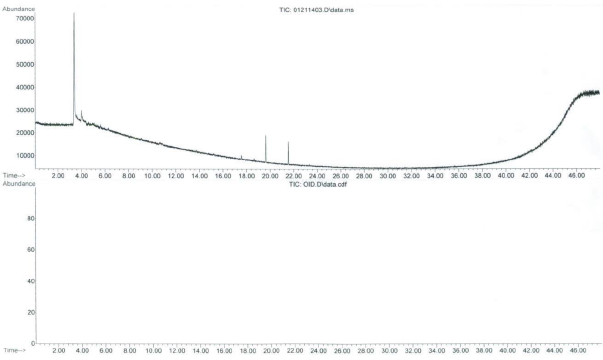
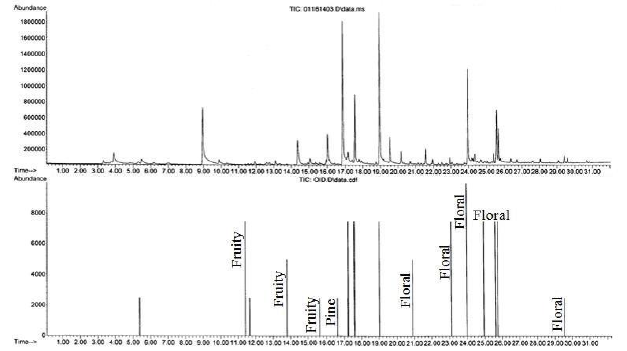
A GC-MS total ion chromatogram and olfactogram for a sandwich bag baseline are shown in Figure 1. Although 3 components were detected by the MSD, no odor components were detected by the analyst at the olfactory port. A GC-MS total ion chromatogram and olfactogram for an air freshener, an odorous consumer product that could contaminate the sandwich bag, are shown in Figure 2. A number of components were detected by both the MSD and the analyst at the olfactory port. The most common scents were that of a fruity or a floral nature.
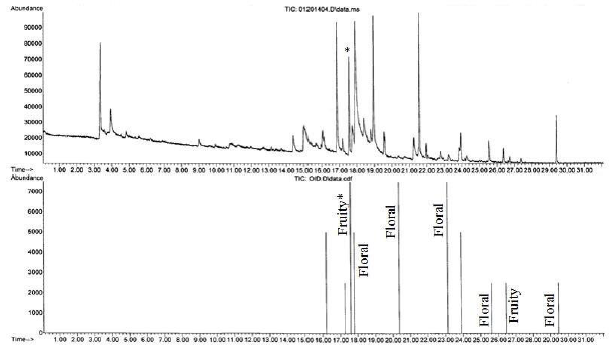
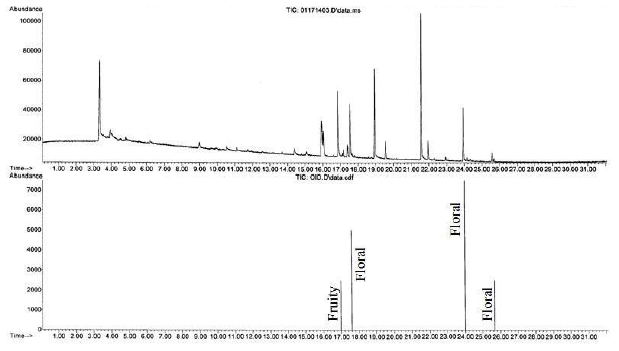
Figure 3 is the GC- MS total ion chromatogram and olfactogram for a sandwich bag after a two hour exposure to the air freshener. Both fruity and floral scents were detected in the exposed sandwich bag, indicating that it had been contaminated by the air freshener. A similar result was achieved for a plastic food storage bowl and shown in Figure 4.
Results obtained for carpet cleaner and a box of dryer sheets (not shown), also displayed odor contamination. This methodology can also be used to aid in the identification of odor components that are detected by both the MSD and the ODP detectors. For example, in Figure 3, the “Fruity*” peak in the olfactogram corresponds to the peak that is marked with an * in the chromatogram.
The mass spectrum obtained for this peak is an excellent match (using the NIST 11 mass spectral database) for 3,7-dimethyl-1,6-octadien- 3-ol (linalool) and is included in Figure 5 (page 6). Linalool is a scent used in over 50 % of perfumed hygiene products and cleaning agents and therefore is a reasonable identification. This can be used to determine which product a scent is coming from. If the odor components can be identified, using the mass spectral data, the ingredients lists can be compared to determine which product(s) may be causing the odor issue.
Conclusion
This work demonstrates a suitable method for monitoring migration of taste and odor species from product to product during storage and/or shipping. Even products that are odorous, but are considered to be non-toxic, should be evaluated prior to storage with food or beverage containers, as odor contamination may lead to taste issues. SPME fibers can be deployed at varying distances from products in a warehouse and analyzed as described above to determine how far the scent of a product travels. The use of a SPME fiber concentrates the odorous components allowing for detection even at trace levels. Storage distances that avoid contamination of a non-odorous product by an odorous product could then be evaluated. Additionally, SPME fibers could be deployed during the shipment of products and then evaluated to determine if cross contamination was possible during shipment as well as storage. In situations where odorants need to be identified and not just detected, mass spectral information can be used in combination with olfactograms (where odor thresholds allow).

Figure 1. GC-MS total ion chromatogram (top) and olfactogram (bottom) for a sandwich bag baseline analysis

Figure 2. GC-MS total ion chromatogram (top) and olfactogram (bottom) for air freshener baseline analysis.

Figure 3. GC-MS total ion chromatogram (top) and olfactogram (bottom) for sandwich bags exposed to the air freshener for two hours

Figure 4. GC-MS total ion chromatogram (top) and olfactogram (bottom) for a plastic, food storage bowl exposed to the air freshener for two hours.

Figure 5. Head-to-tail comparison of experimental mass spectrum for the peak labeled * in Figure 3 (top, red) and the library mass spectrum for 3, 7-dimethyl-1, 6-octadien-3-ol (linalool).
Ready to Get Started?
Give us a call and speak with an actual scientist.

